CrownJewel 2 (HTB-Sherlock)


CrownJewel 2 is the final Sherlock in the Hack the Box Detecting Active Directory Attacks track. It's been rewarding tackling these labs and getting more exposure to the various tools of the trade when it comes to blue teaming in cyber.
Scenario
Forela's Domain environment is pure chaos. Just got another alert from the Domain controller of NTDS.dit database being exfiltrated. Just one day prior you responded to an alert on the same domain controller where an attacker dumped NTDS.dit via vssadmin utility. However, you managed to delete the dumped files kick the attacker out of the DC, and restore a clean snapshot. Now they again managed to access DC with a domain admin account with their persistent access in the environment. This time they are abusing ntdsutil to dump the database. Help Forela in these chaotic times!!
The Files
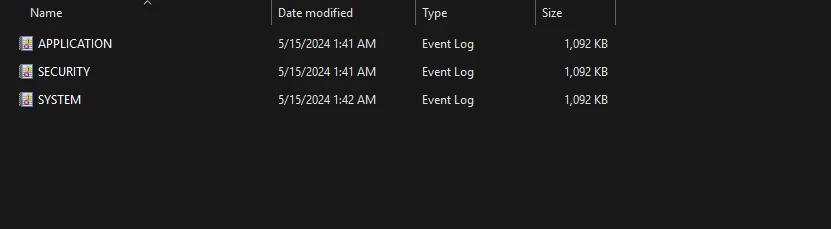
In typical Sherlock fashion we have a single .zip file that contains some files for the investigation process. In the case of this investigation, extracting the archive we can see a folder called Artifacts that has a set of .evtx files. Each of the log files pertain to a different log provider, Application, Security, and System.
Task 1
When utilizing ntdsutil.exe to dump NTDS on disk, it simultaneously employs the Microsoft Shadow Copy Service. What is the most recent timestamp at which this service entered the running state, signifying the possible initiation of the NTDS dumping process?
Service start/stop and other related conditions are logged by the SYSTEM log provider. We should take a look at the SYSTEM .evtx file to take a look. For the sake of enhancing learning and also getting more practice with Eric Zimmerman's Forensic Tools, I will be making use of EvtxECmd and Timeline Explorer for analysis.
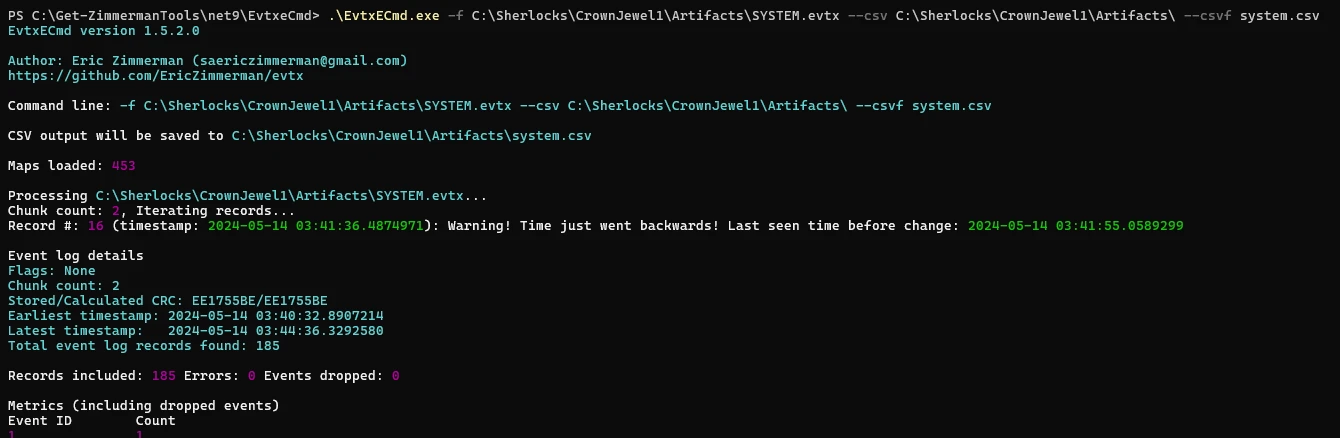
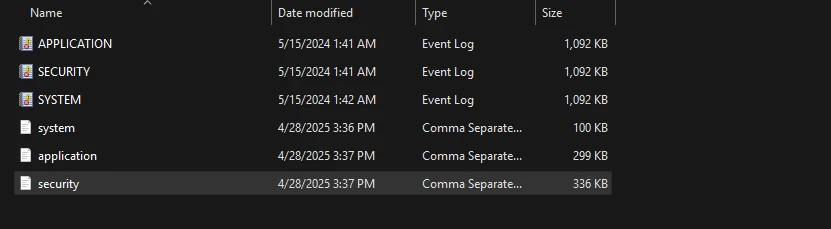
In the above I processed the SYSTEM.evtx log file using the tool. This parses and formats the log file into a .csv file that can be viewed inside of Timeline Explorer, allowing for viewing and filtering of log data in ways the Windows Event Viewer cannot. I also did this for the rest of the log files present in the artifacts folder.
Opening the new system.csv file in Timeline Explorer, I filtered the Map Description column for the term started, pertaining to Service started or stopped. Then I filtered the Payload Data column for the word shadow. This was sufficient to bring up all events that pertained to the starting/stopping of the Volume Shadow Copy service.
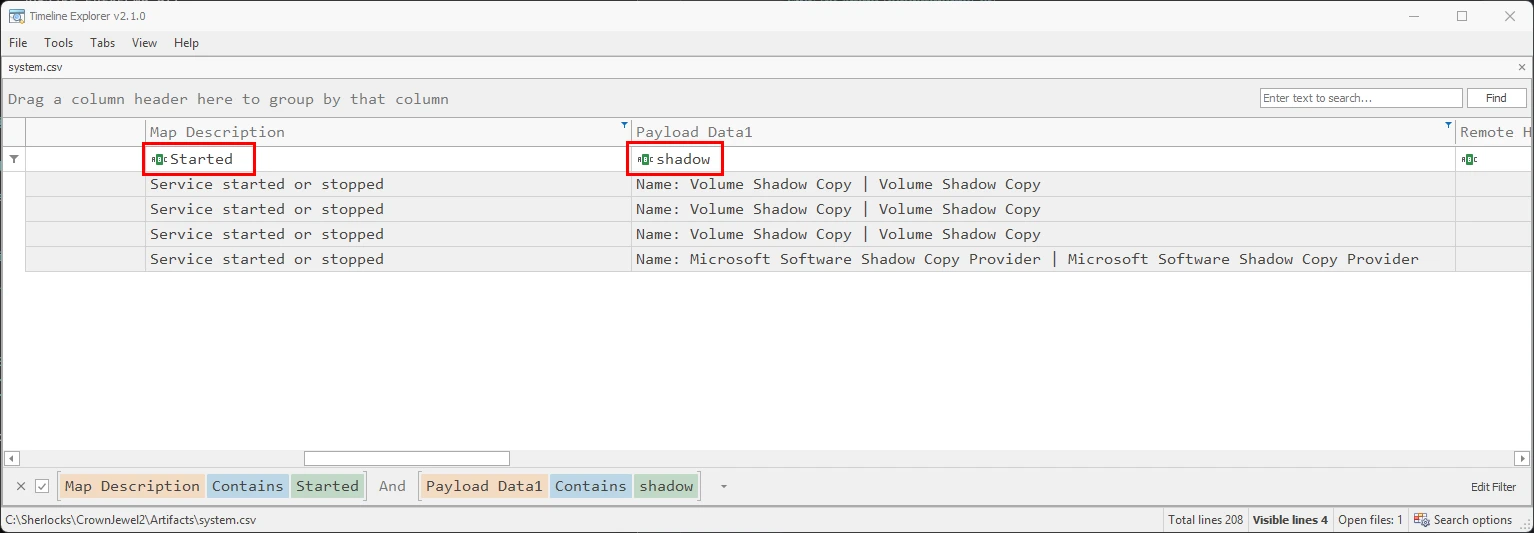
Found 4 logs in total, the most recent of which being the starting of the Volume Shadow copy service on 05/15/2024 05:39:55. Take note that when EvtwECmd parses log files, it normalizes the time format to UTC.
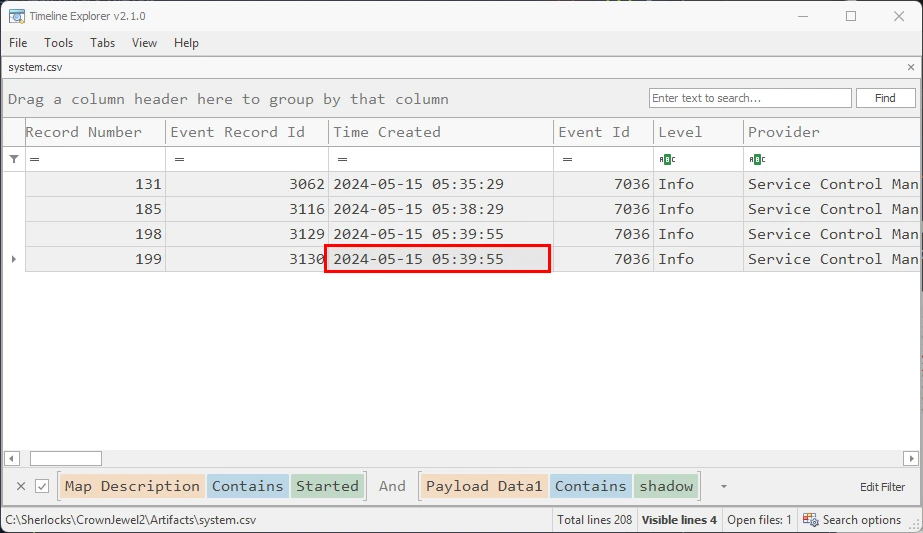
Changing the time/date format to HTB flag requirements, the task flag would be, 2024-05-15 05:39:55.
Task 2
Identify the full path of the dumped NTDS file.
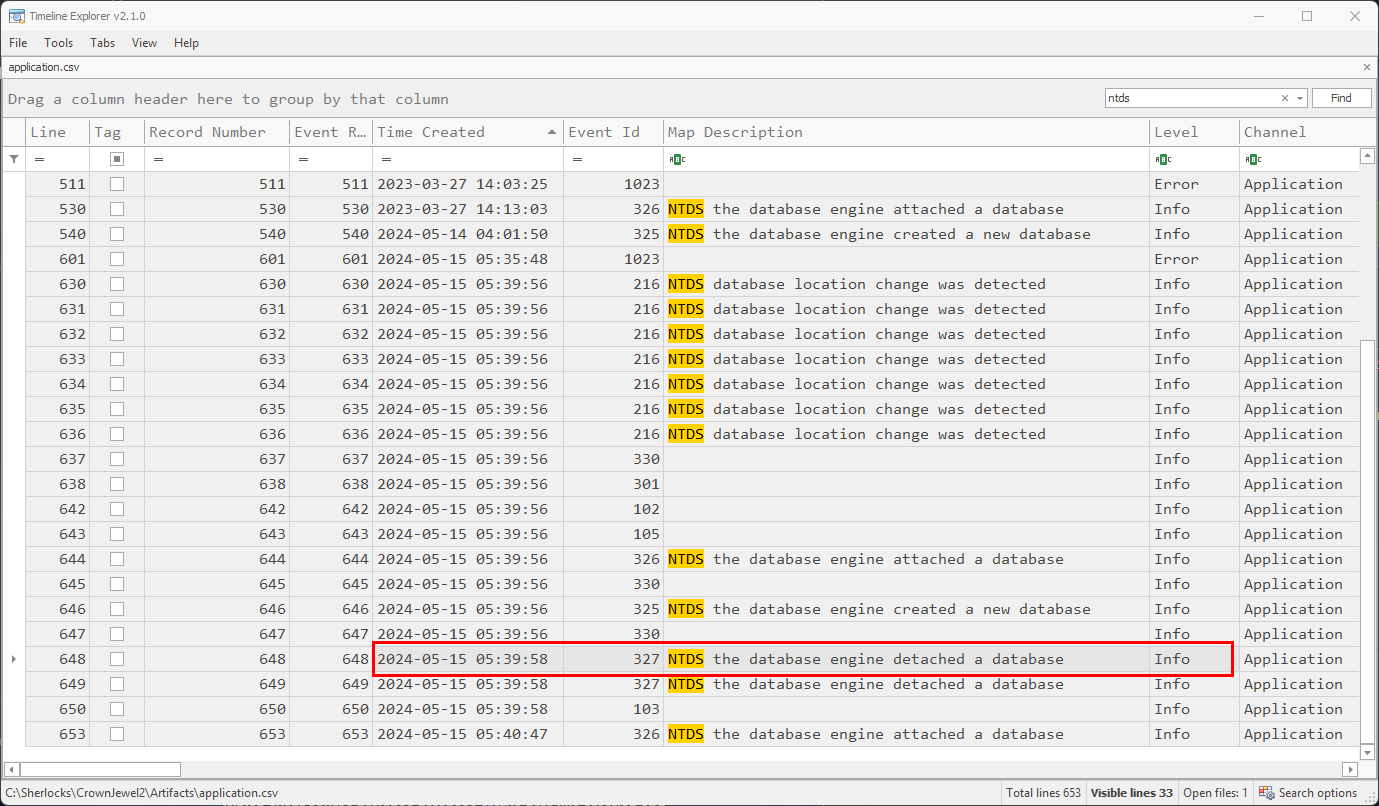
This time, we will load up our parsed application logs in Timeline Explorer. The normal path for the NTFS ntds.dit database file is C:\Windows\NTDS\, any deviation from this would indicate that malicious activity is going on related to the database file. Opening the file, I filtered the logs via the find function and took a look at the results.
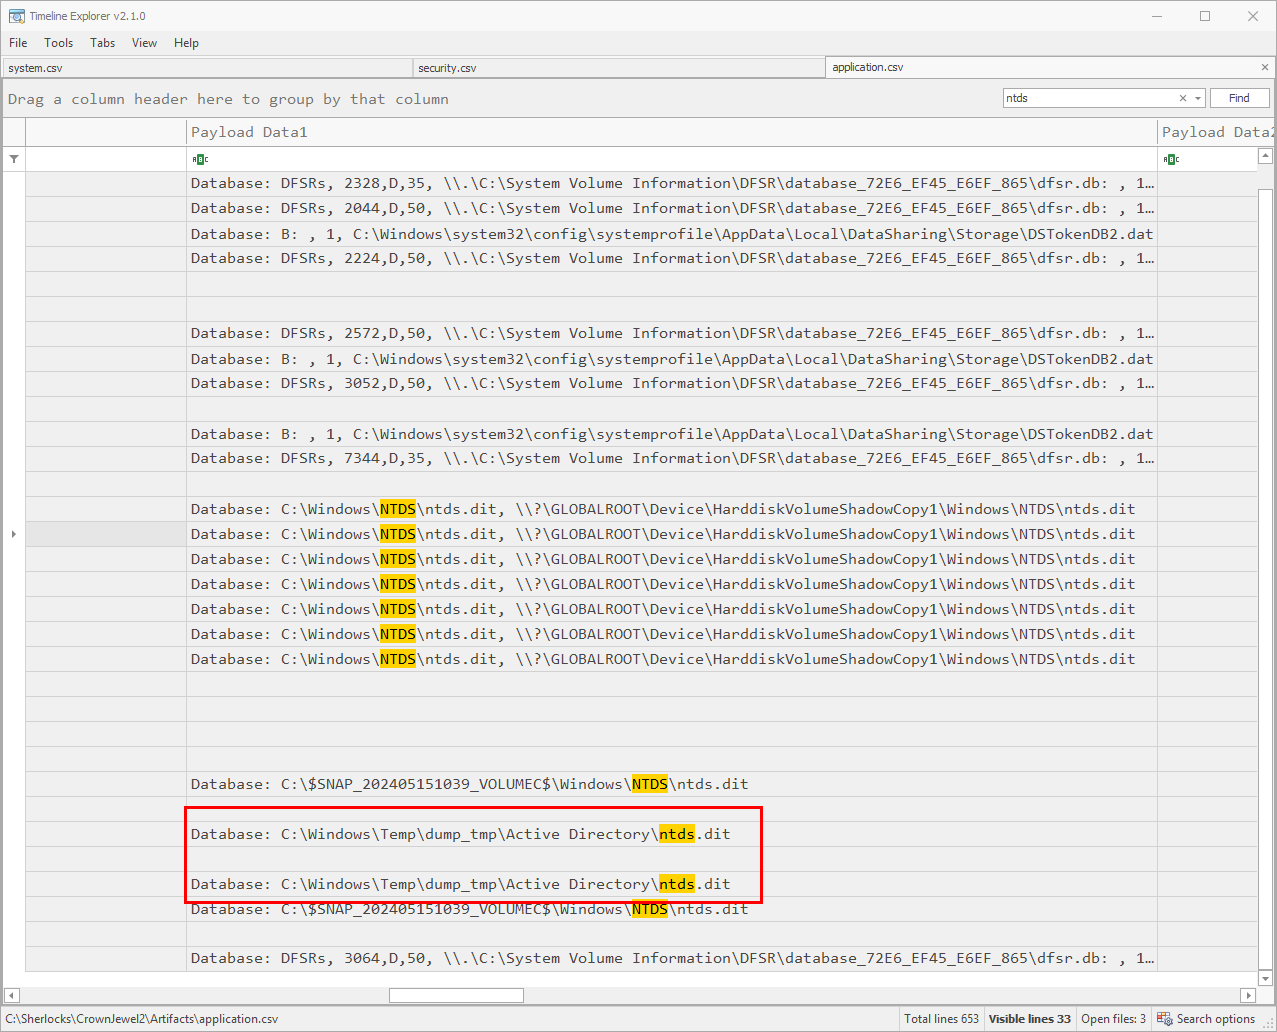
In the image above we are focused on the payload data of each log event. Taking a look toward the bottom of the log results we can see entries that pertain to the directory C:\Windows\Temp\dump_tmp\Active Directory\ntds.dit. The related event ID is 325 and is a log generated when a new database is created.
As it turns out, this directory is indeed the task flag.

Task 3
When was the database dump created on the disk?
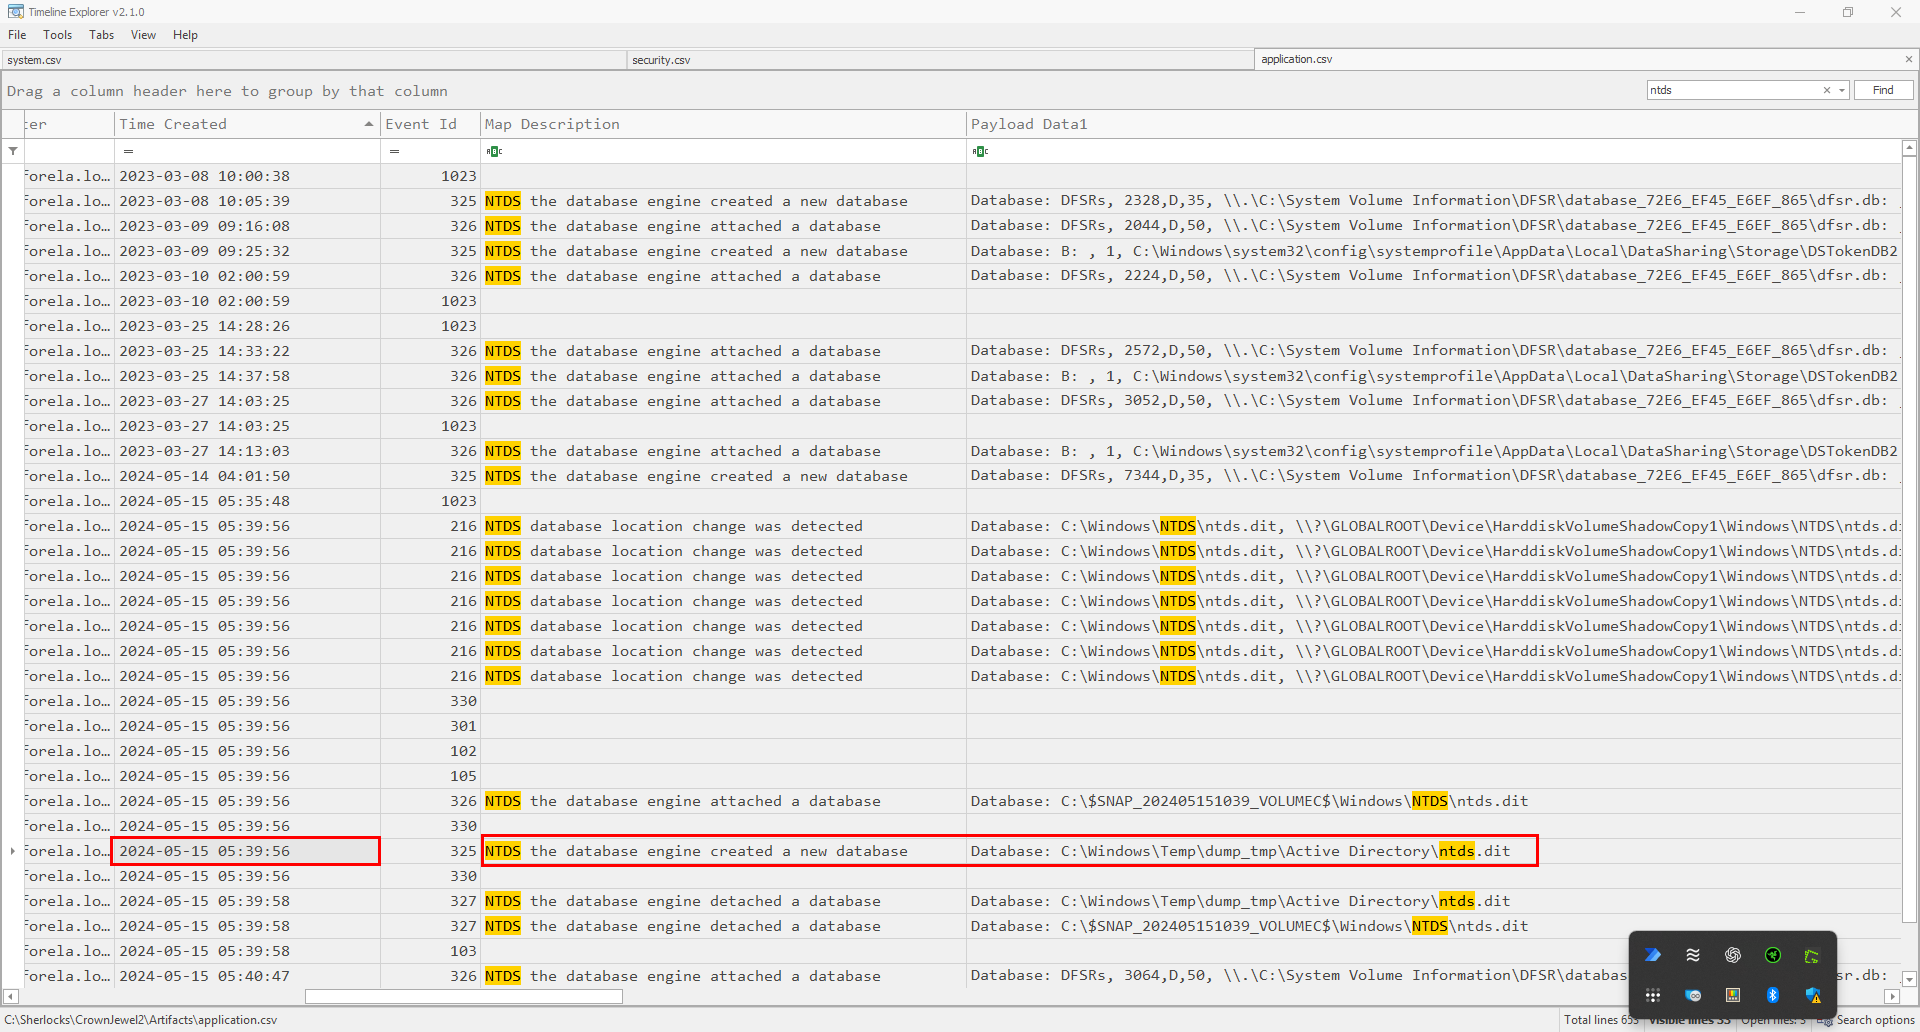
Going back to the same event log and checking the time, we can see that the database dump was created on 2024-05-15 05:39:56.

Task 4
When was the newly dumped database considered complete and ready for use?
Reviewing the parsed application logs in Timeline Explorer, we can see an event a few seconds after where the ntds database was detached, this signifies that the dump of the database was completed and thus, the time of this event should be the task flag.
The task flag in this case being: 2024-05-15 05:39:58

Task 5
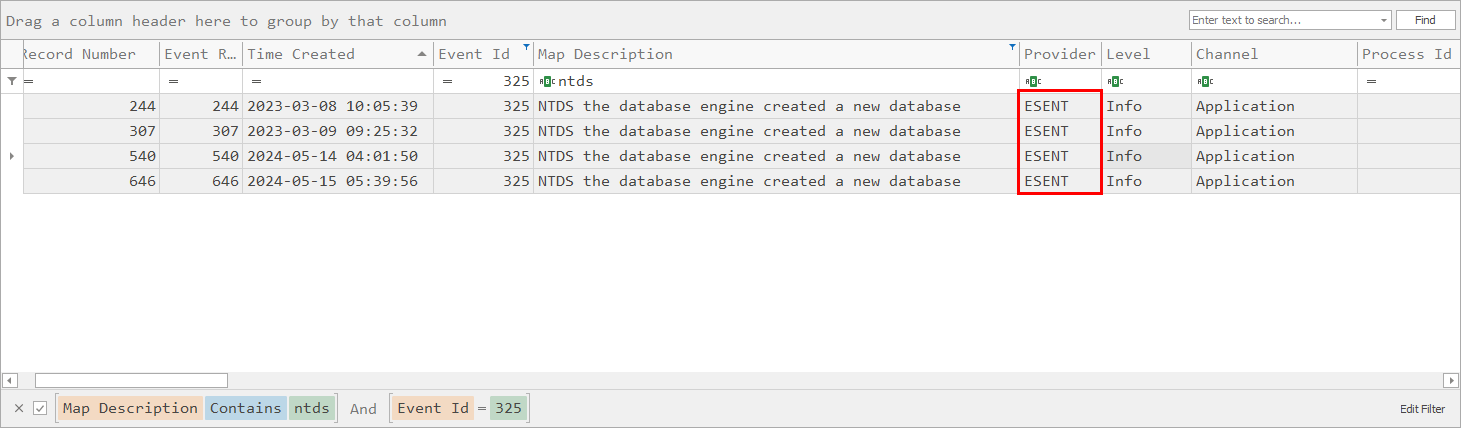
Event logs use event sources to track events coming from different sources. Which event source provides database status data like creation and detachment?
In Windows when logs are generated they come from different providers. Providers are tasked with logging information specific to a type of action, application, OS function, etc. They allow for tracking just like the task describes. Finding the provider generated logs is a simple task and is made even simpler via the parsing done by EvtwECmd. In Timeline Explorer all we need to do is adjust the filtering and the columns to clearly see that the provider for creation and detachment of databases comes from the ESENT provider.
Task 6
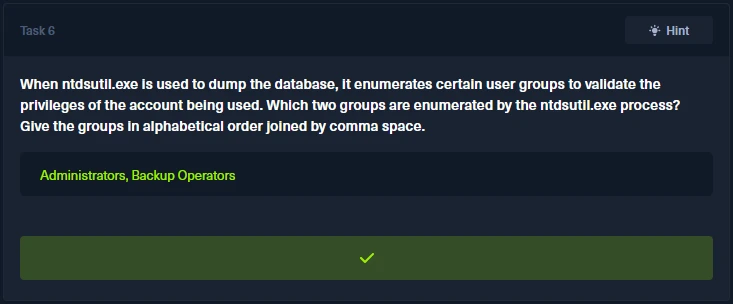
When ntdsutil.exe is used to dump the database, it enumerates certain user groups to validate the privileges of the account being used. Which two groups are enumerated by the ntdsutil.exe process? Give the groups in alphabetical order joined by comma space.
Did some research into what event IDs pertain to the enumeration of groups on a given environment. I found that event ID 4799 logs when a security-enabled local group is enumerated. 1 These events are logged to the security section event logs so let's start there in our search.
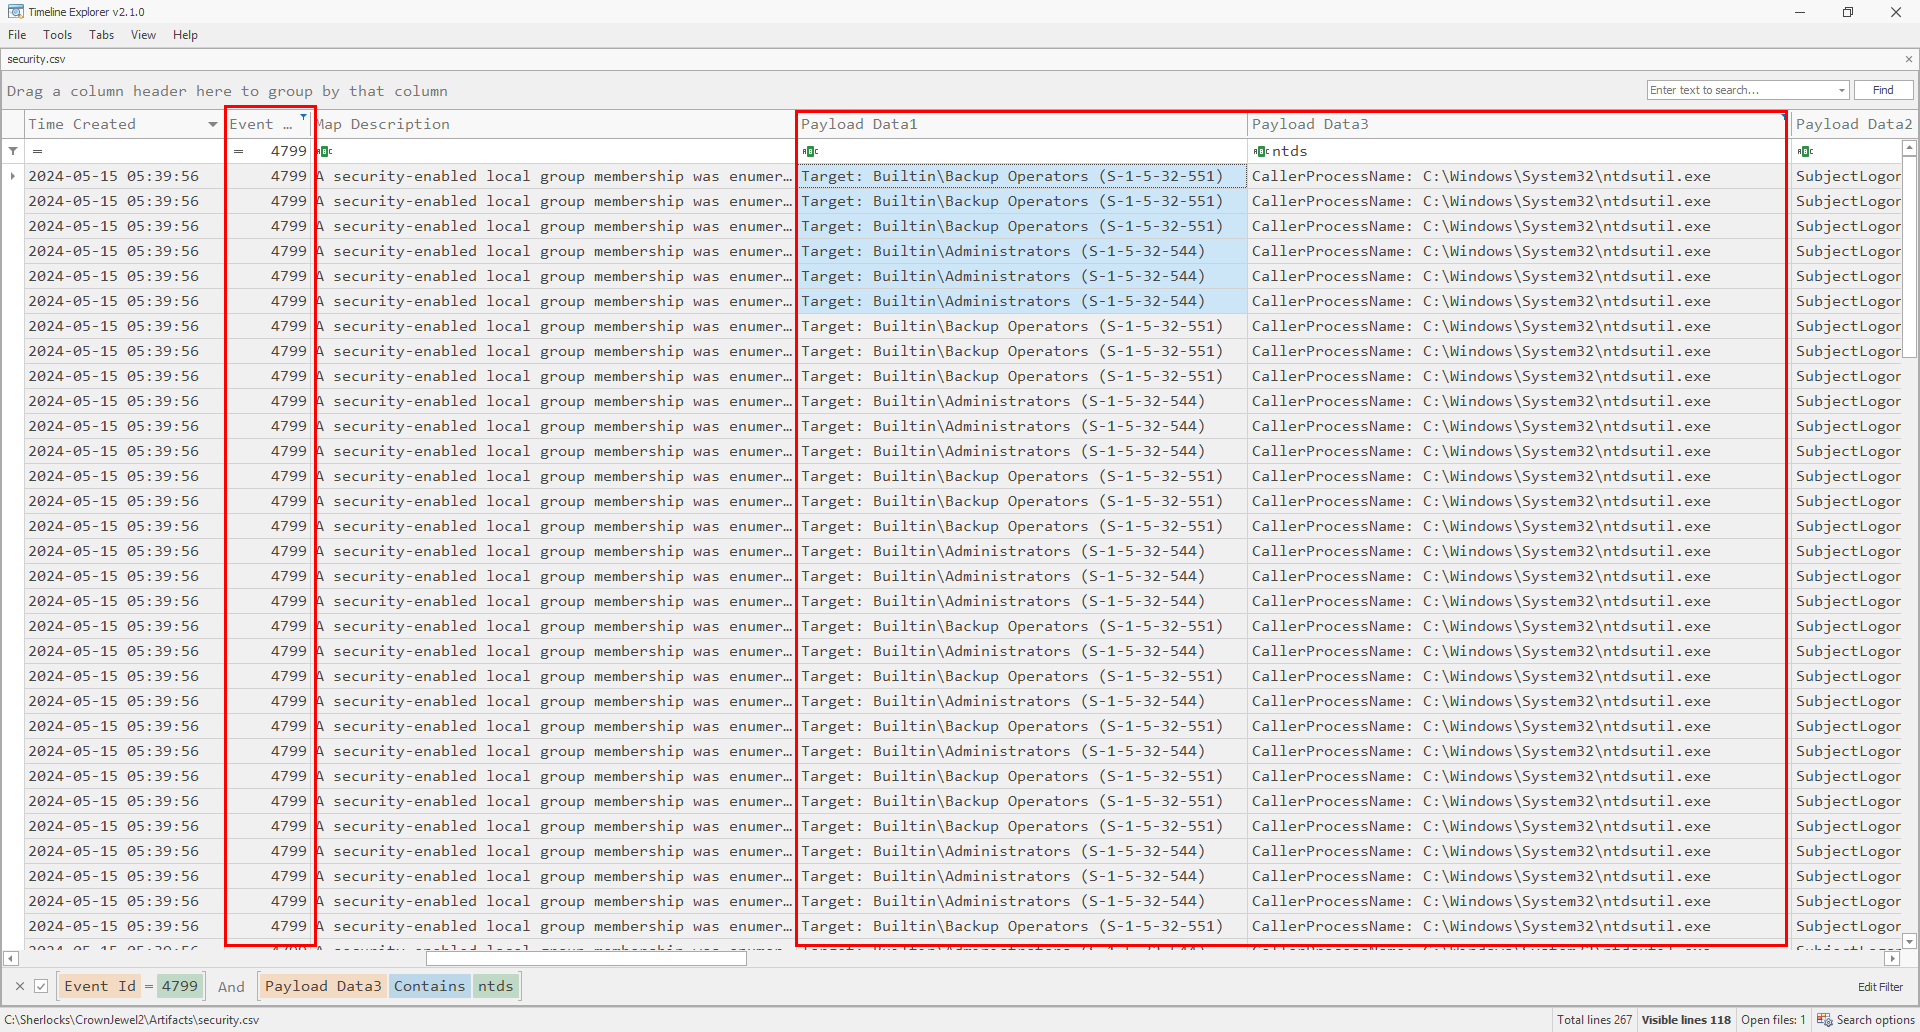
Looking at the parse security log, check the image above, I filtered for the event ID 4799 and I also observed that there are 3 payload columns, of which Payload Data 1 contains the target group for enumeration and Payload Data 3 contains the process carrying out the enumeration. I filtered for ntds in column 3 as well. With the filters applied you can see that around the same time that the ntds database was dumped, we have multiple enumerations for the Administrators and Backup Operators groups.
Task 7
Now you are tasked to find the Login Time for the malicious Session. Using the Logon ID, find the Time when the user logon session started.
At the start of this Sherlock investigation we are given the key detail that we are inside of an Active Directory environment. In most cases we should be looking for Kerberos authentication of some kind when a user logs into a machine or the domain controller. In AD environments Kerberos is used primarily when the client and the target server/services are all on the same domain/domain-joined. 2
With that in mind, what event IDs pertain to Kerberos authentication? Well if you haven't read my blog post on Kerberoasting you should check it out. It has details related to how the Kerberos authentication process is carried out, and how threat actors exploit the process. For the sake of time and to focus on obtaining the task flag I will list the event ID's what we need here.
4768- A Kerberos Authentication Ticket (TGT) was requested. 34769- A Kerberos service ticket was requested. 4
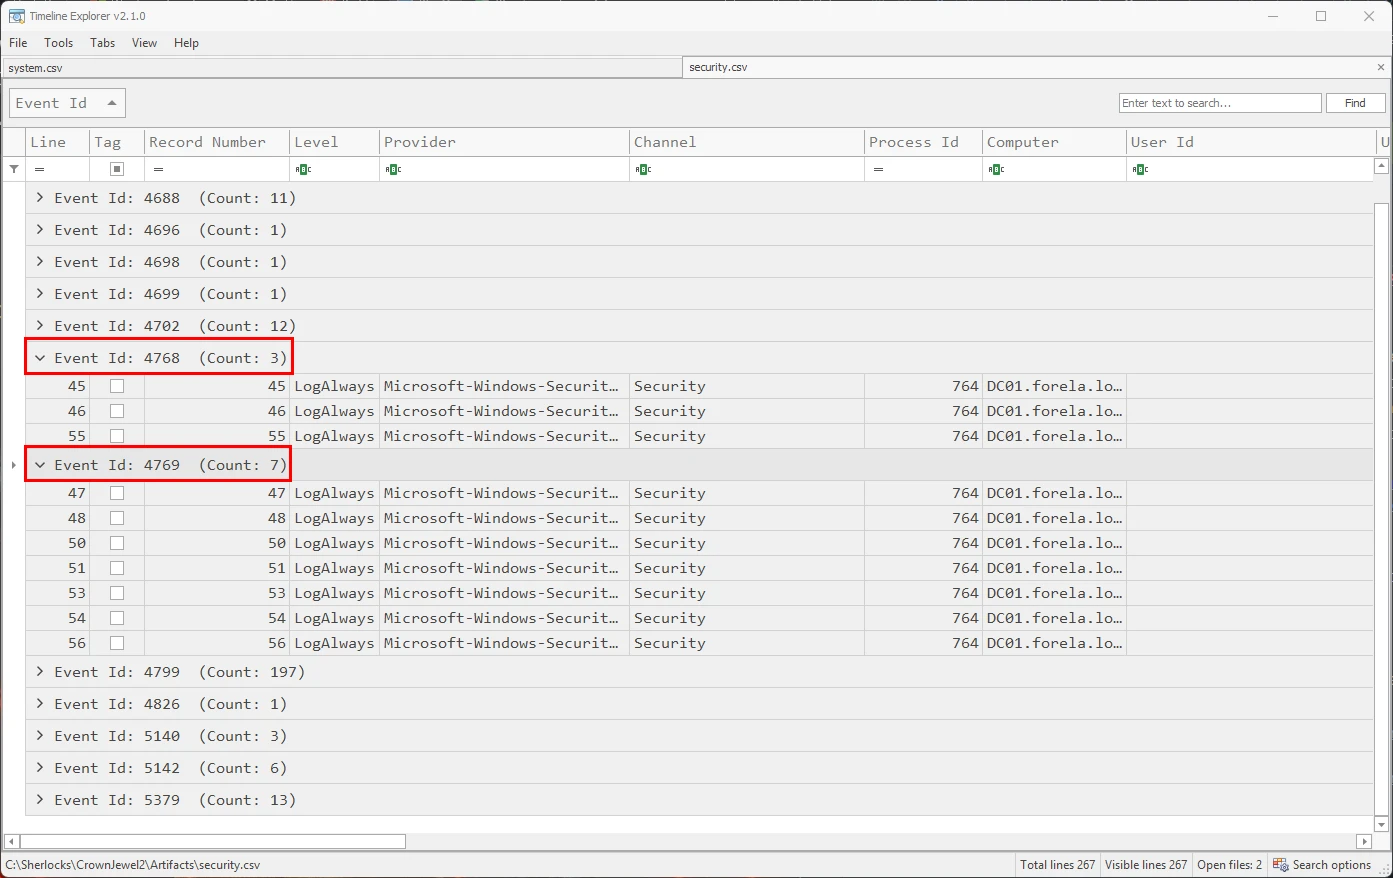
In Timeline Explorer we have the ability to group events via column values, in the image above I grouped all the events by event ID. We can see that we have a count of 3 events for event ID 4768 and 7 for event ID 4769.
Digging deeper into the log details I hid all of the unneeded columns, focusing the time of event, description, and payload data of the filtered event logs. We can see that a Kerberos ticket granting ticket, was requested and granted for the Forela/Administrator account. This was followed up with a service ticket request at the exact same time, meaning that the time of malicious session was 2024-05-15 05:36:31.
🔑 Key Takeaways
- 🧭 Parsing
.evtxlogs with EvtxECmd and loading them into Timeline Explorer gave us the flexibility to filter, search, and correlate events in a way that the standard Event Viewer just doesn’t allow. This workflow continues to prove itself useful across these Sherlock labs. - 🕵️♂️ Attackers leveraged the Volume Shadow Copy Service as part of the NTDS dump. Tracking when this service starts can clue us in to the initial stages of database exfiltration activity.
- 📂 Any time you see the
ntds.ditfile show up outside of its default location atC:\Windows\NTDS\, alarms should go off. In this case, it showed up in a temp directory, which is a strong indicator of suspicious behavior. - 🧾 Logs from the ESENT provider helped us understand the lifecycle of the NTDS database—creation, detachment, and overall status. If the database gets detached, odds are someone finished dumping it.
- 🔐 Group enumeration showed up under Event ID 4799, and we were able to confirm that
ntdsutil.exequeried both the Administrators and Backup Operators groups. This step is part of validating that the attacker has the necessary privileges to pull off the dump. - ⏱️ Pulling authentication details using Event IDs 4768 and 4769 helped us determine the exact login time for the attacker’s session. Kerberos logs are a solid place to start when tracing malicious logons in Active Directory environments.
All in all, this lab reinforced the importance of knowing where to look, how to correlate logs across multiple providers, and how to piece together the timeline of an attack from what the system leaves behind.